# 1. Dashboard
#### 1.1 Dashboard
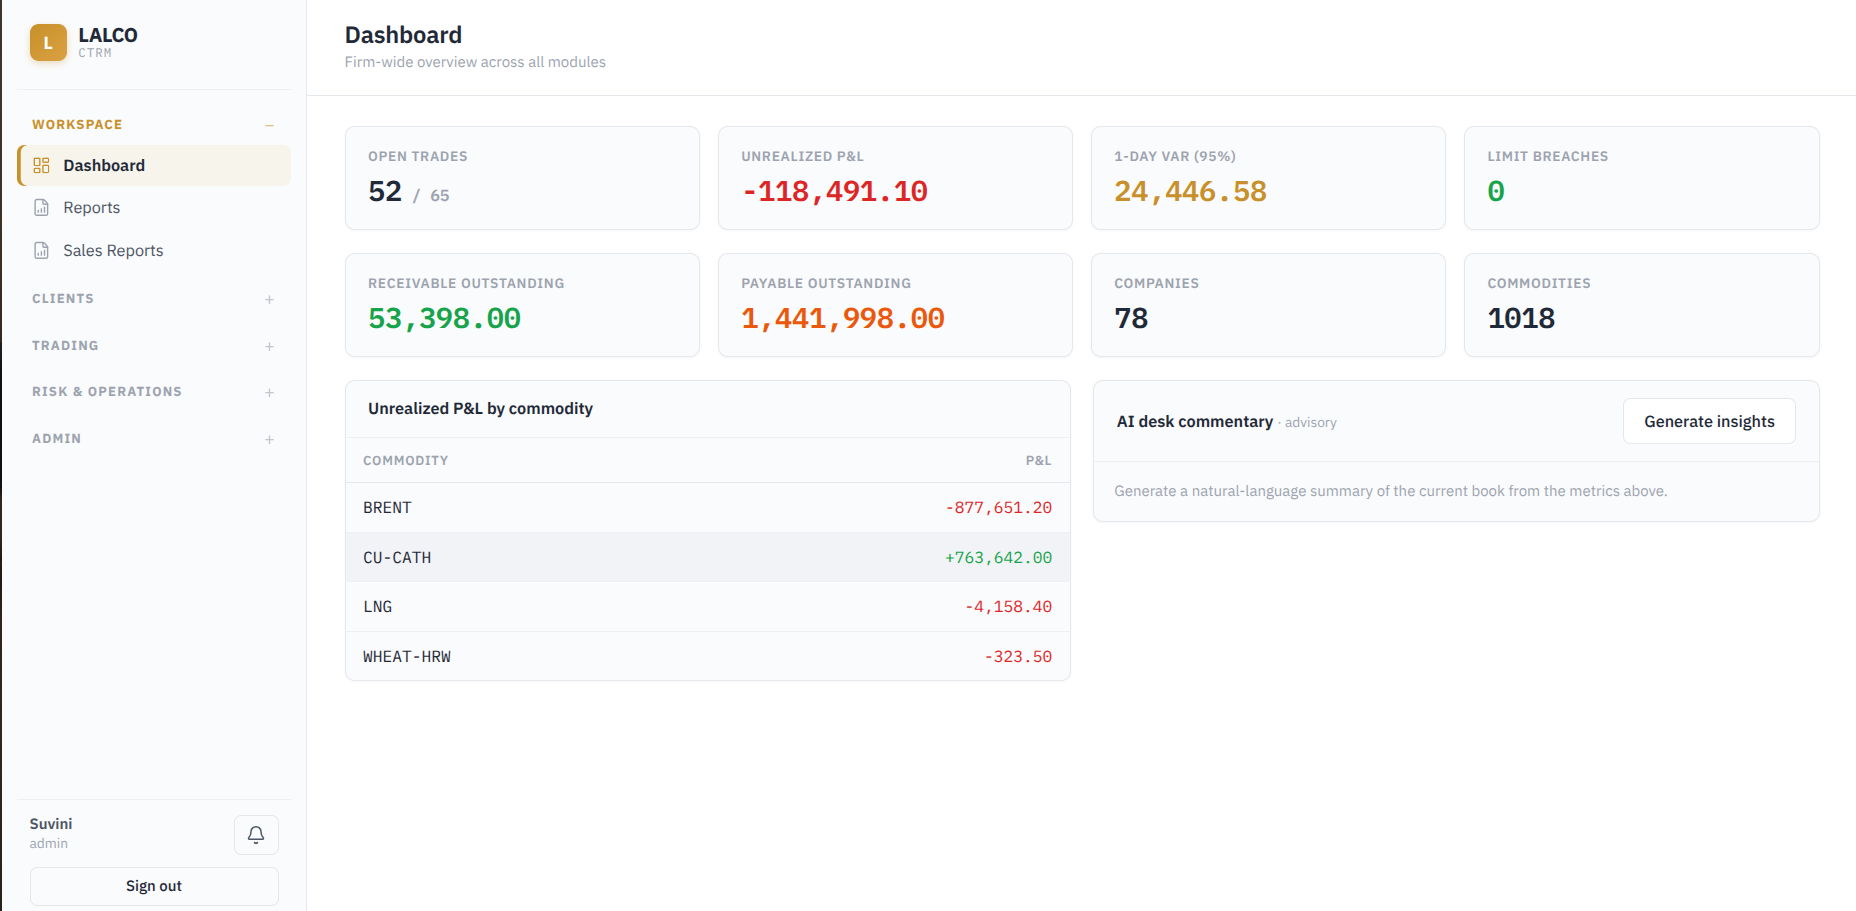
The Dashboard provides a firm-wide overview of key information across the CTRM system. It allows users to quickly monitor the current trading, financial, and risk position without opening each individual module.
[](http://wiki.lalco.la/uploads/images/gallery/2026-08/image.png)
Key indicators :
- Open Trades
- Unrealized P&L
- 1-Day VaR (95%) (Max expected Loss
- Limit Breaches
- Receivable Outstanding
- Counterparties
- Commodities
- Unrealized P&L by commodity
**Key Characteristics :**
- AI Desk Commentary : Generates a natural language summary of the current book based on the metrics displayed on the dashboard.
---
#### 1.2 Reports
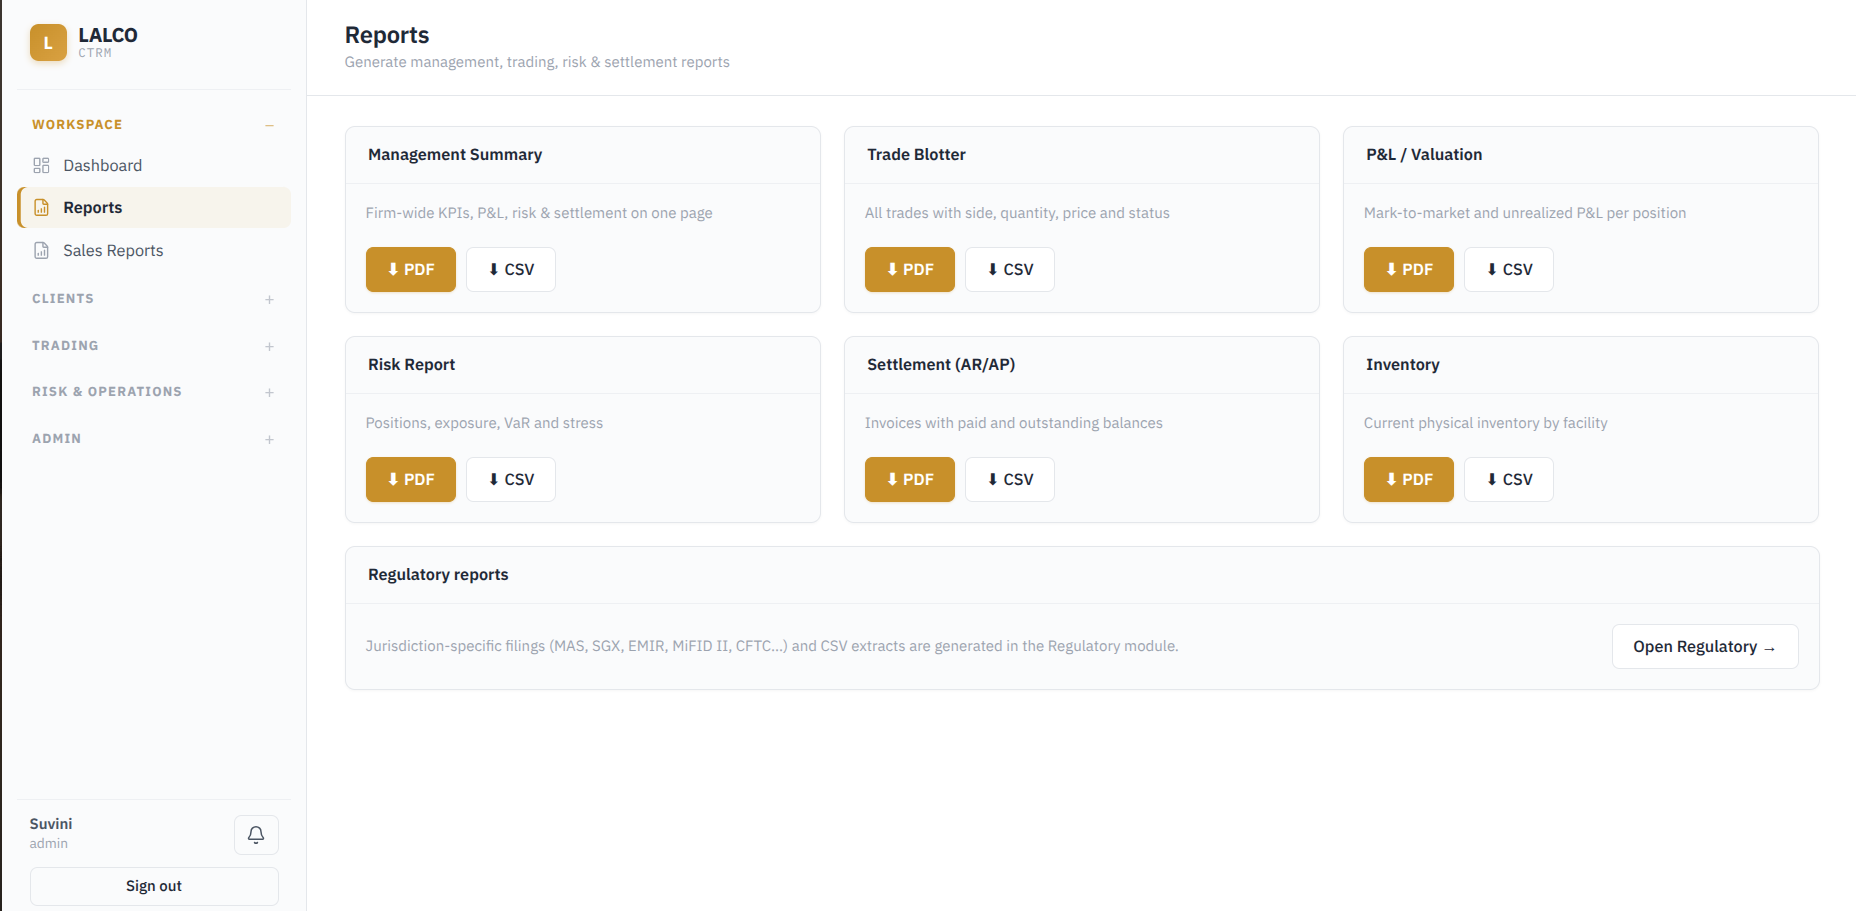
The **Reports** module allows users to generate and download key management, trading, risk, settlement, and inventory reports. The reports can be downloaded in Pdf
[](http://wiki.lalco.la/uploads/images/gallery/2026-08/4nLimage.png)
**Available Reports:**
- Management Summary: Firm wide KPIs, P&L, Risk and settlement information
- Trade Blotter: Overall view of recorded trades, including the trade side (Buy/Sell), quantity price, and current status.
- P&L / Valuation: Mark-to-market values and unrealized P&L by position.
- Risk Report: Positions, exposure, VaR, and stress information
- Settlement(AR/AP): Invoices, paid amounts, and outstanding balances.
- Inventory: Current physical inventory by facility.
**Key Characteristic:**
- Regulatory reports are handled separately through the **Regulatory module**, which can be accessed directly from the Reports page.
---
#### 1.3 Sales Reports
The **Sales Reports** module provides sales-related reporting based on a selected time period.
[](http://wiki.lalco.la/uploads/images/gallery/2026-08/PfTimage.png)
**Report Views :**
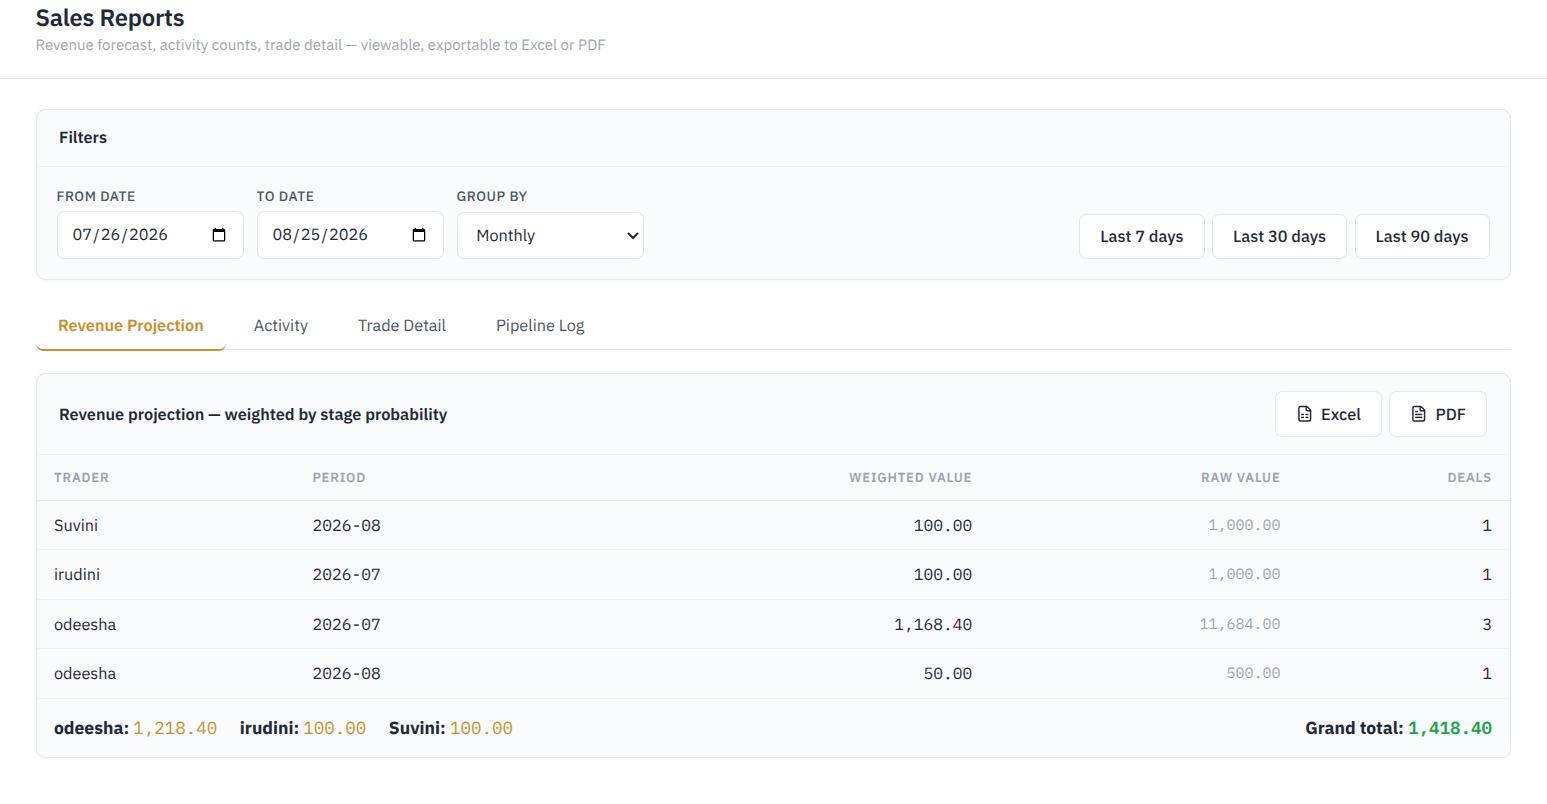
1. Revenue projection
Displays projected revenue by trader and period, including the weighted value, raw value, and number of deals.
[](http://wiki.lalco.la/uploads/images/gallery/2026-08/0Zwimage.png)
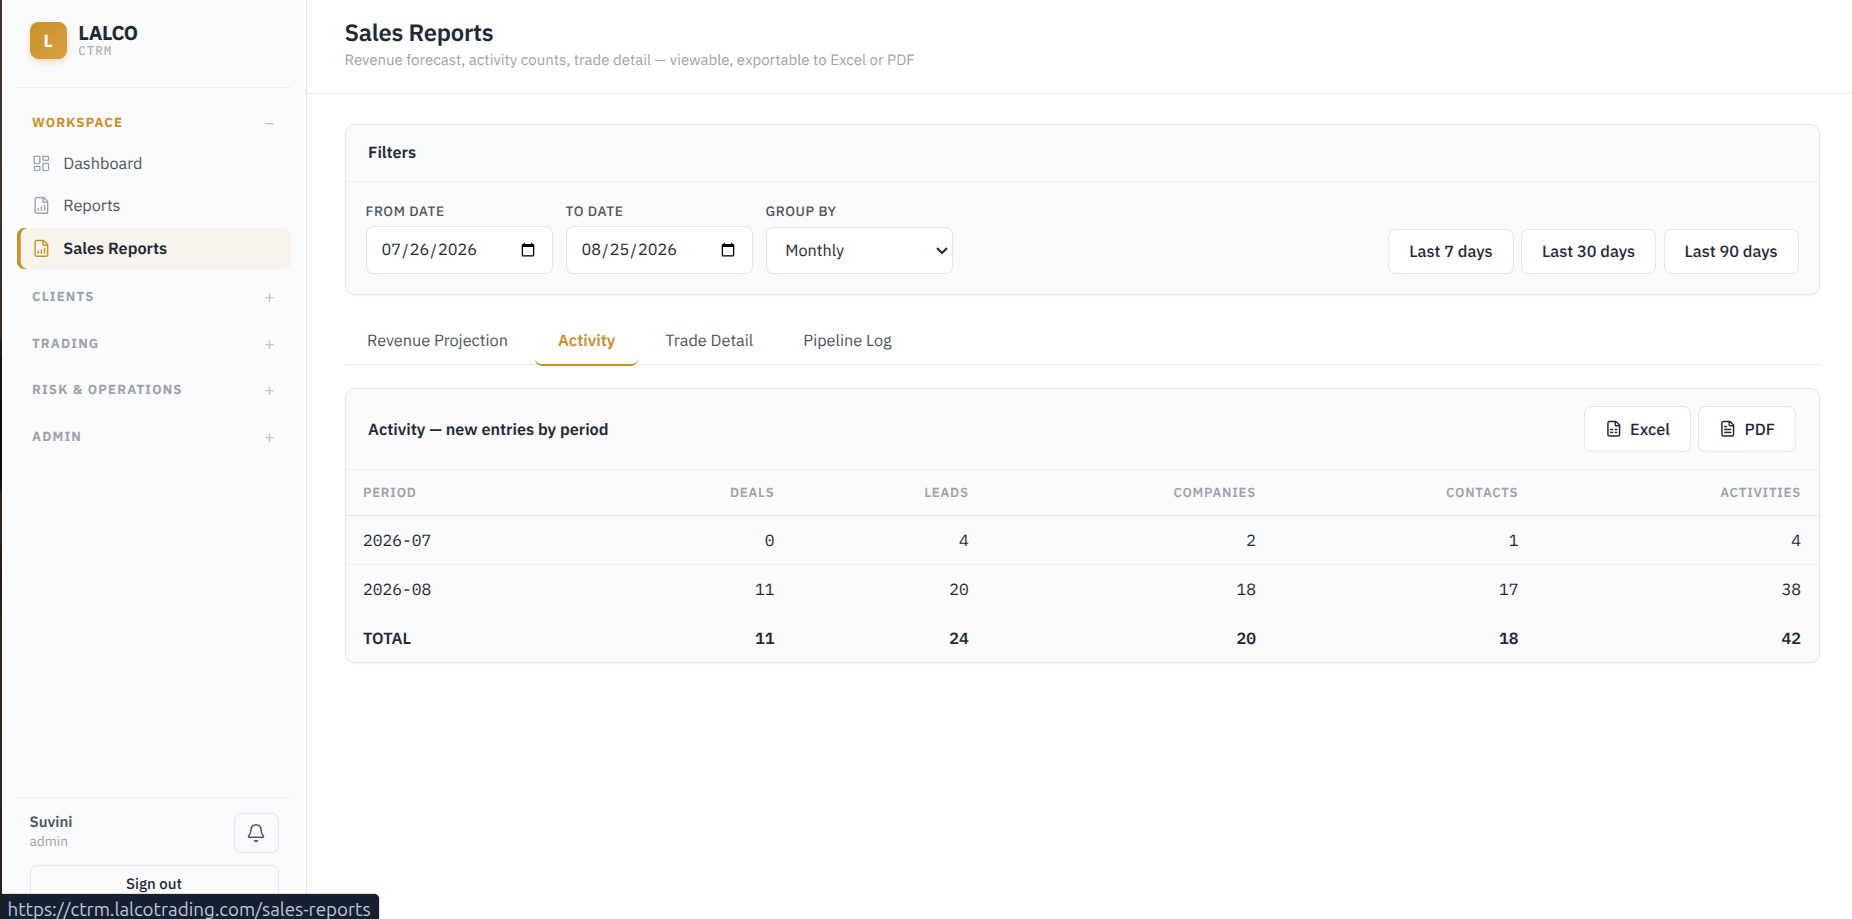
2. Activity
Displays the number of records related to Deals, Leads, Companies, Contacts, Activities [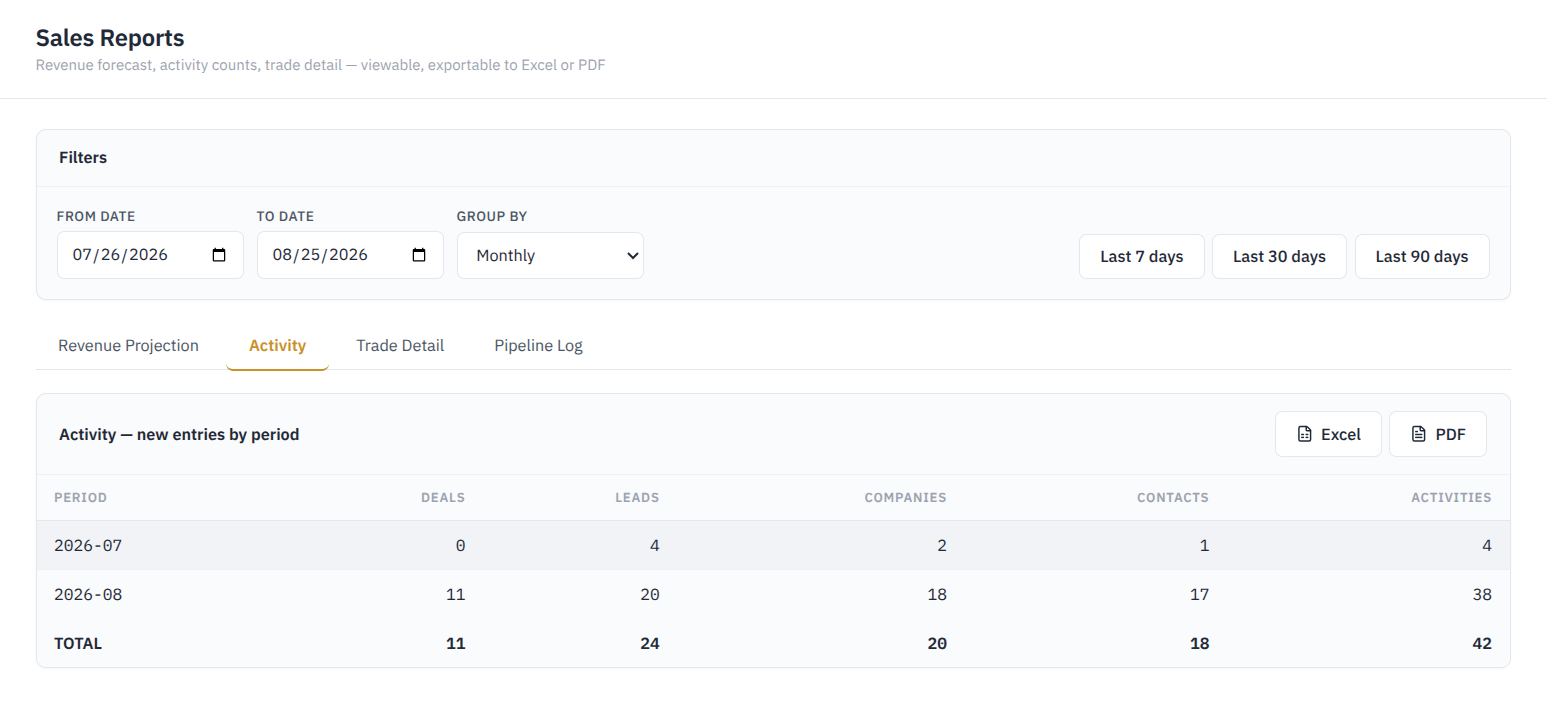](http://wiki.lalco.la/uploads/images/gallery/2026-08/pUcimage.png)
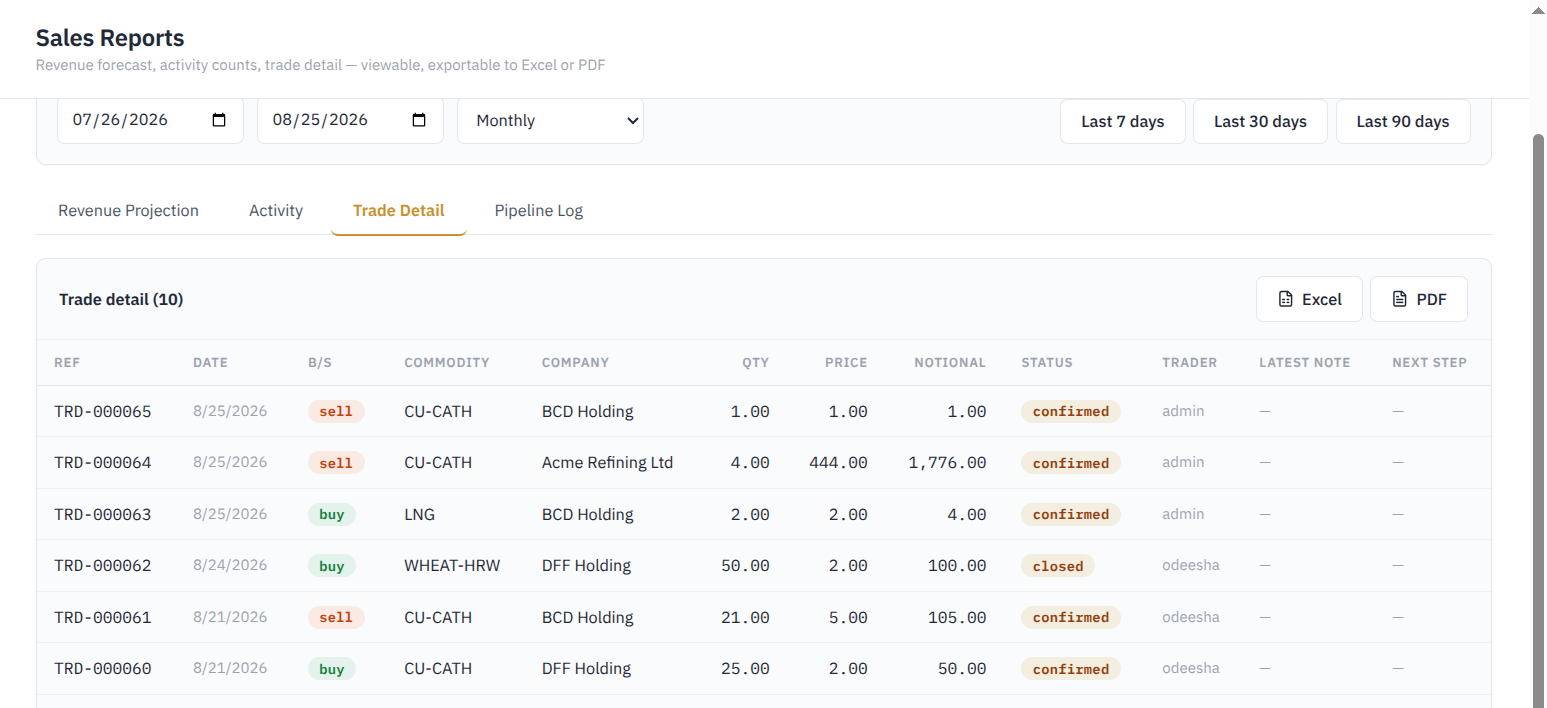
3. Trade Detail
Individual trades recorded and main information related to each trade. Including **Ref, Date, B/S, Commodity, Company, Qty, Price, Notional, Status, Trader, Latest Note, Next Step**
[](http://wiki.lalco.la/uploads/images/gallery/2026-08/DA2image.png)
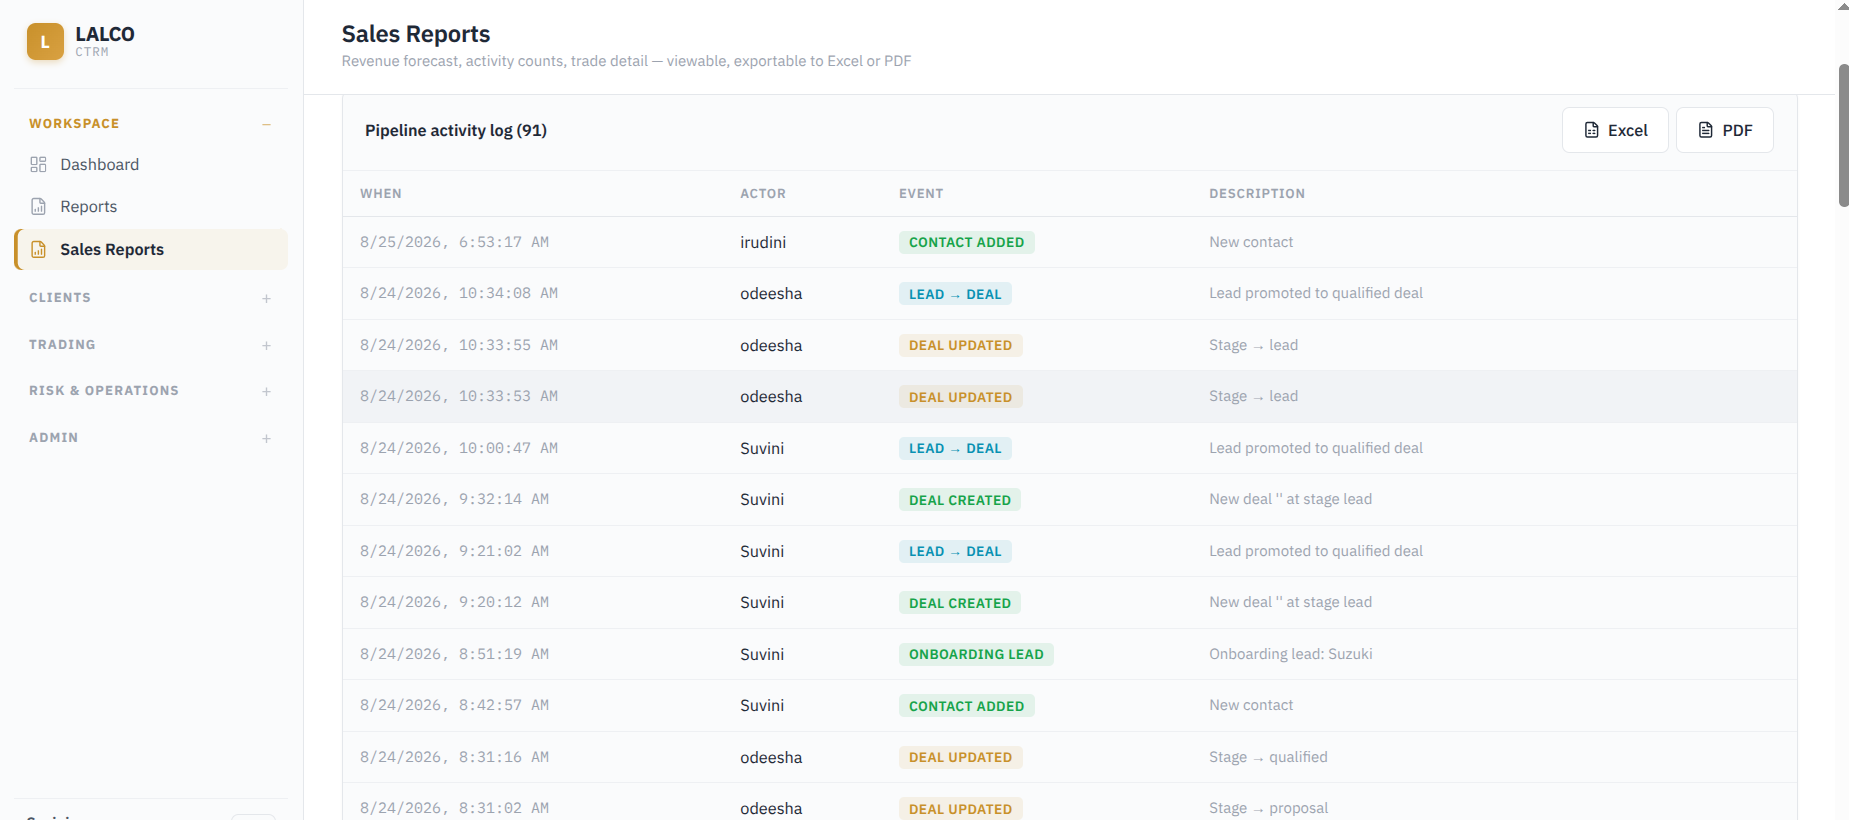
4. Pipeline Log
Chronological record of activities and changes made within the sales pipeline. Helps to see What happend (Event), When it happend (When) and who performed the action (Actor) and the description.
[](http://wiki.lalco.la/uploads/images/gallery/2026-08/Kknimage.png)
Reports can be filtered by :
- From Date
- To Date
- Group by (Monthly, Weekly, Daily)
- Last 7 Days
- Last 30 Days
- Last 90 Days