Excel
This Document offers a collection of tips and tricks for using Excel.
Excel
To become proficient in Excel, there are several key sections and topics you should focus on. Here’s a breakdown of the main areas to learn:
1. Basic Excel Skills
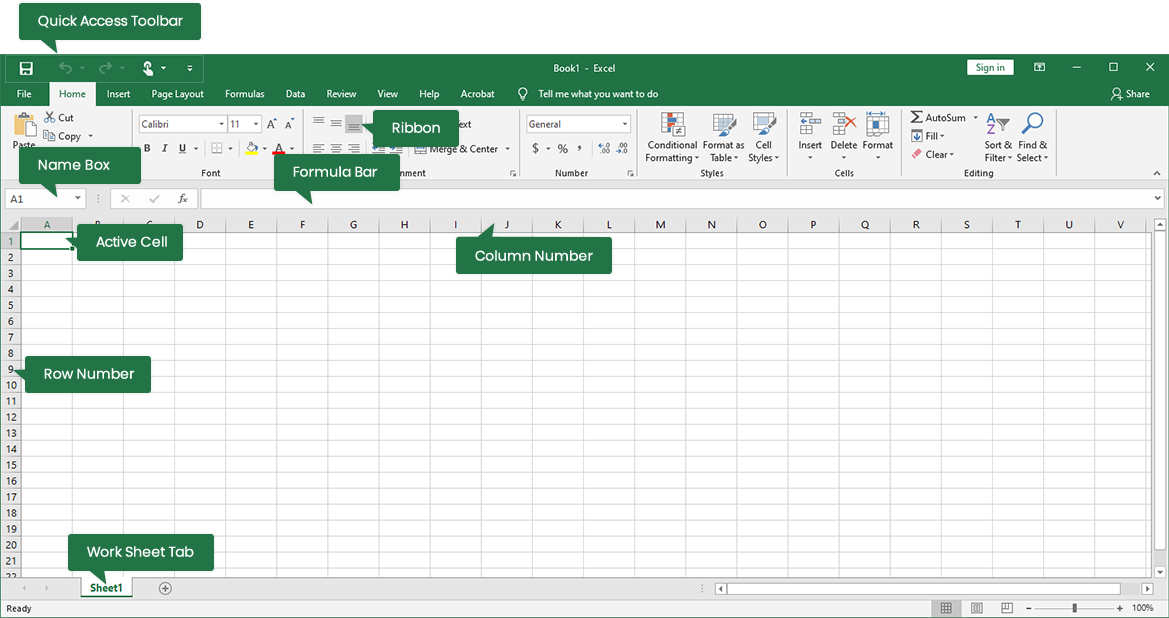
- Excel Interface : Learn the Ribbon, toolbar, and how to navigate Excel.
- Entering Data : Understanding how to input, edit, and format data in cells.
- Basic Formulas : Learn basic arithmetic operations like =SUM(), =AVERAGE(), =MIN(), =MAX().
- Cell Referencing : Learn about relative, absolute, and mixed references (`A1`, $A$1, `A$1`).
- Formatting Cells : Formatting numbers, dates, text, alignment, and using styles.
- Copy, Cut, Paste, and AutoFill : Learn how to manipulate data quickly.
2. Intermediate Formulas and Functions
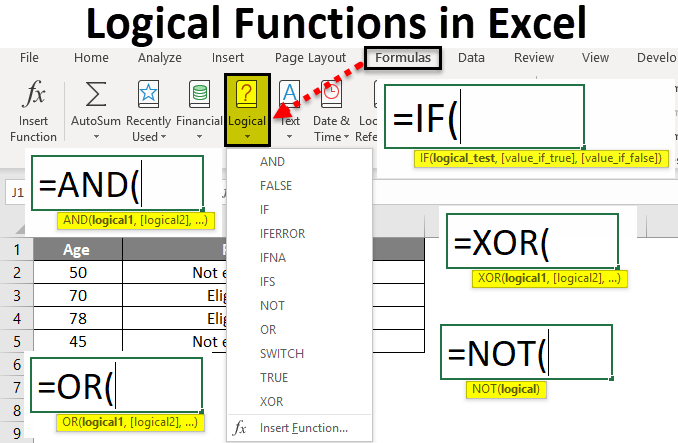
- Logical Functions : =IF(), =AND(), =OR(), =NOT().
- Lookup Functions : =VLOOKUP(), =HLOOKUP(), =INDEX(), =MATCH(), =XLOOKUP().
- Text Functions : =CONCATENATE(), =LEFT(), =RIGHT(), =LEN(), =TRIM().
- Date and Time Functions : =TODAY(), =NOW(), =DATEDIF(), =DAY(), =MONTH(), =YEAR().
- Math and Statistical Functions : =SUMIF(), =COUNTIF(), =AVERAGEIF(), =ROUND().
- Error Handling : =IFERROR(), =ISERROR().
3. Data Management
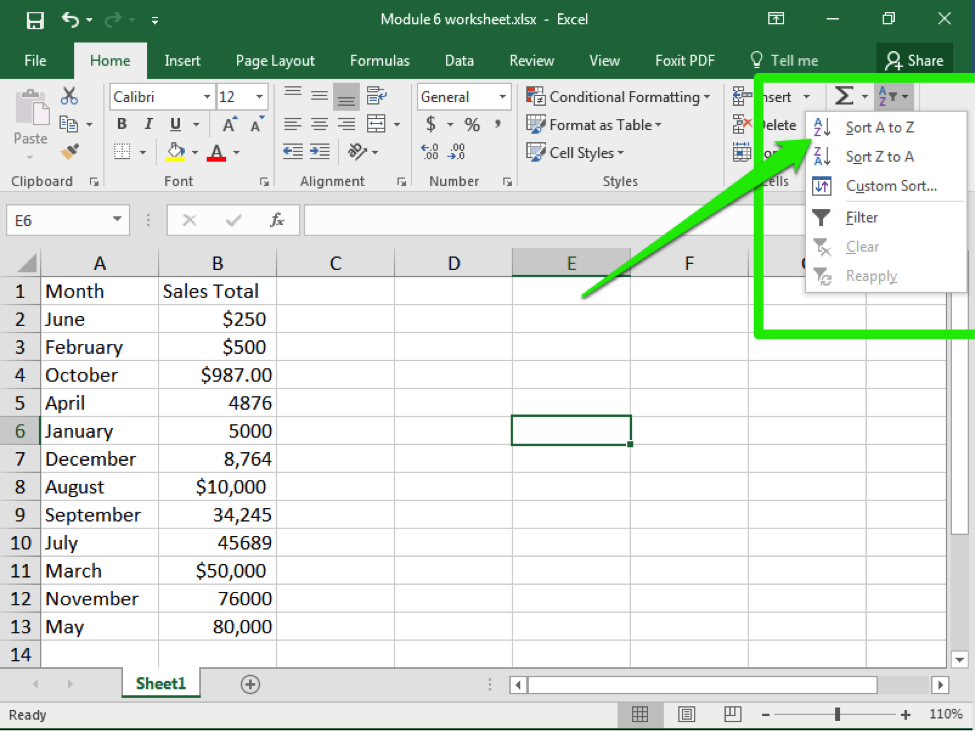
- Sorting and Filtering : Learn how to sort data and apply filters.
- Data Validation : Setting up rules for data entry, dropdown lists.
- Conditional Formatting : Highlighting cells based on specific conditions.
- Named Ranges : Defining names for ranges and using them in formulas.
- Remove Duplicates : Learn how to clean and manage large datasets.
4. Charts and Visualization
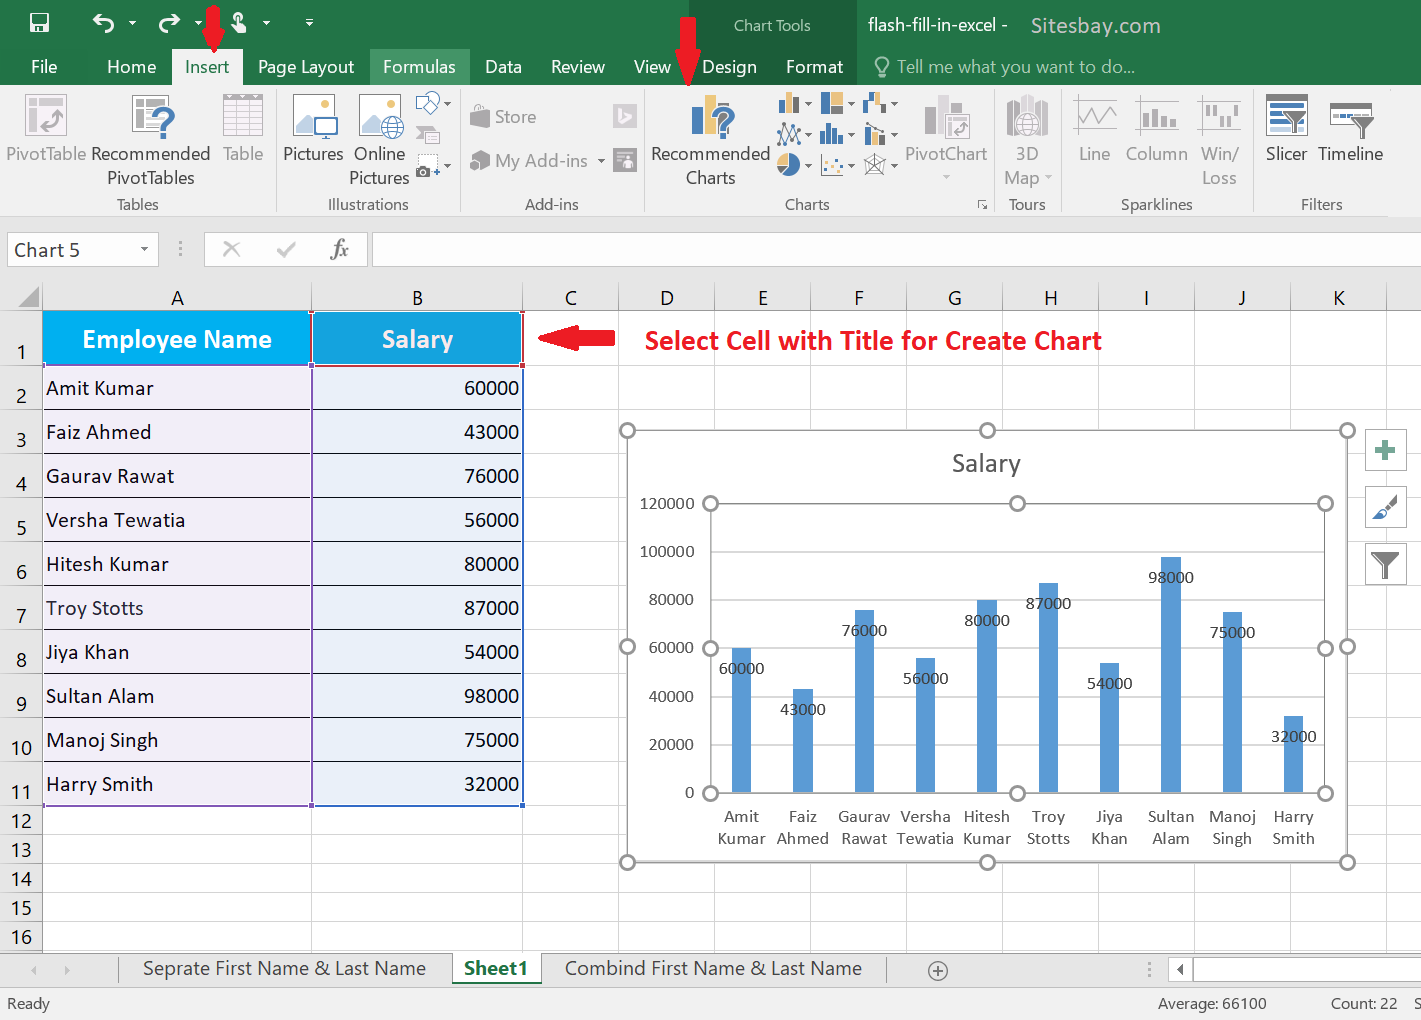
- Creating Charts : Learn how to create bar charts, line charts, pie charts, etc.
- Chart Customization : Formatting, adjusting data series, adding labels, etc.
- Sparklines : Tiny charts within a cell.
- Pivot Charts : Creating charts from Pivot Tables for data analysis.
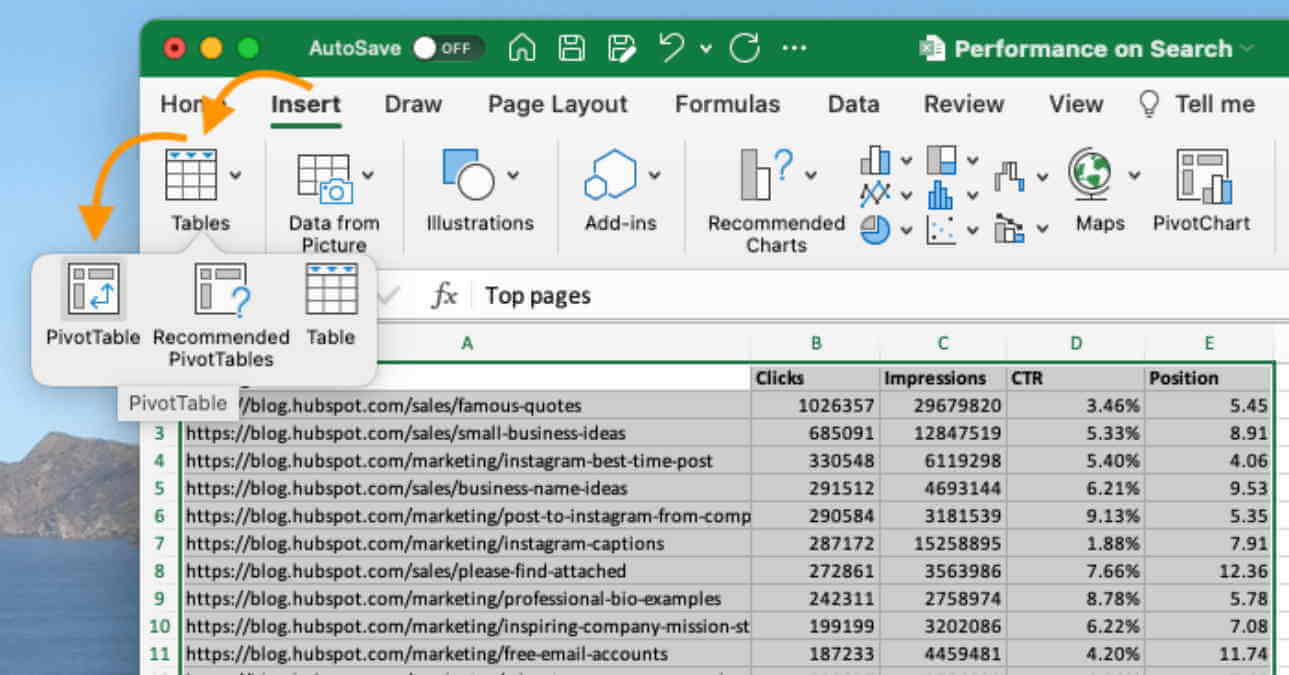
5. Pivot Tables
- Creating Pivot Tables : Learn how to create Pivot Tables to summarize data.
- Sorting and Filtering in Pivot Tables : Organizing data effectively in Pivot Tables.
- Group Data : Grouping data by categories like months, years, etc.
- Slicers and Timeline : Adding interactivity to Pivot Tables.
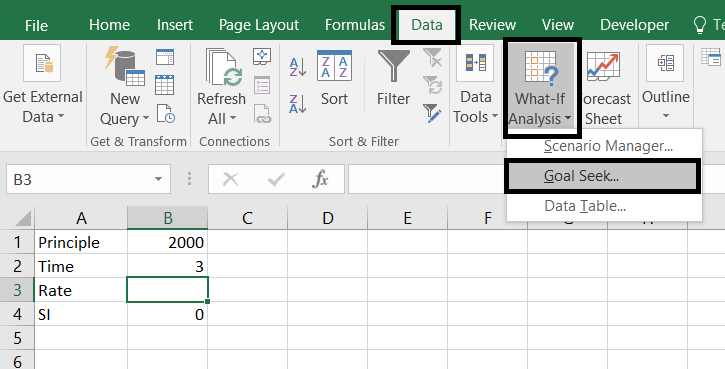
6. Data Analysis Tools
- What-If Analysis : Goal Seek, Scenario Manager, and Data Tables.
- Solver : Learn how to solve complex problems with Solver.
- Forecasting and Trendlines : Use Excel’s forecasting tools to project future data.
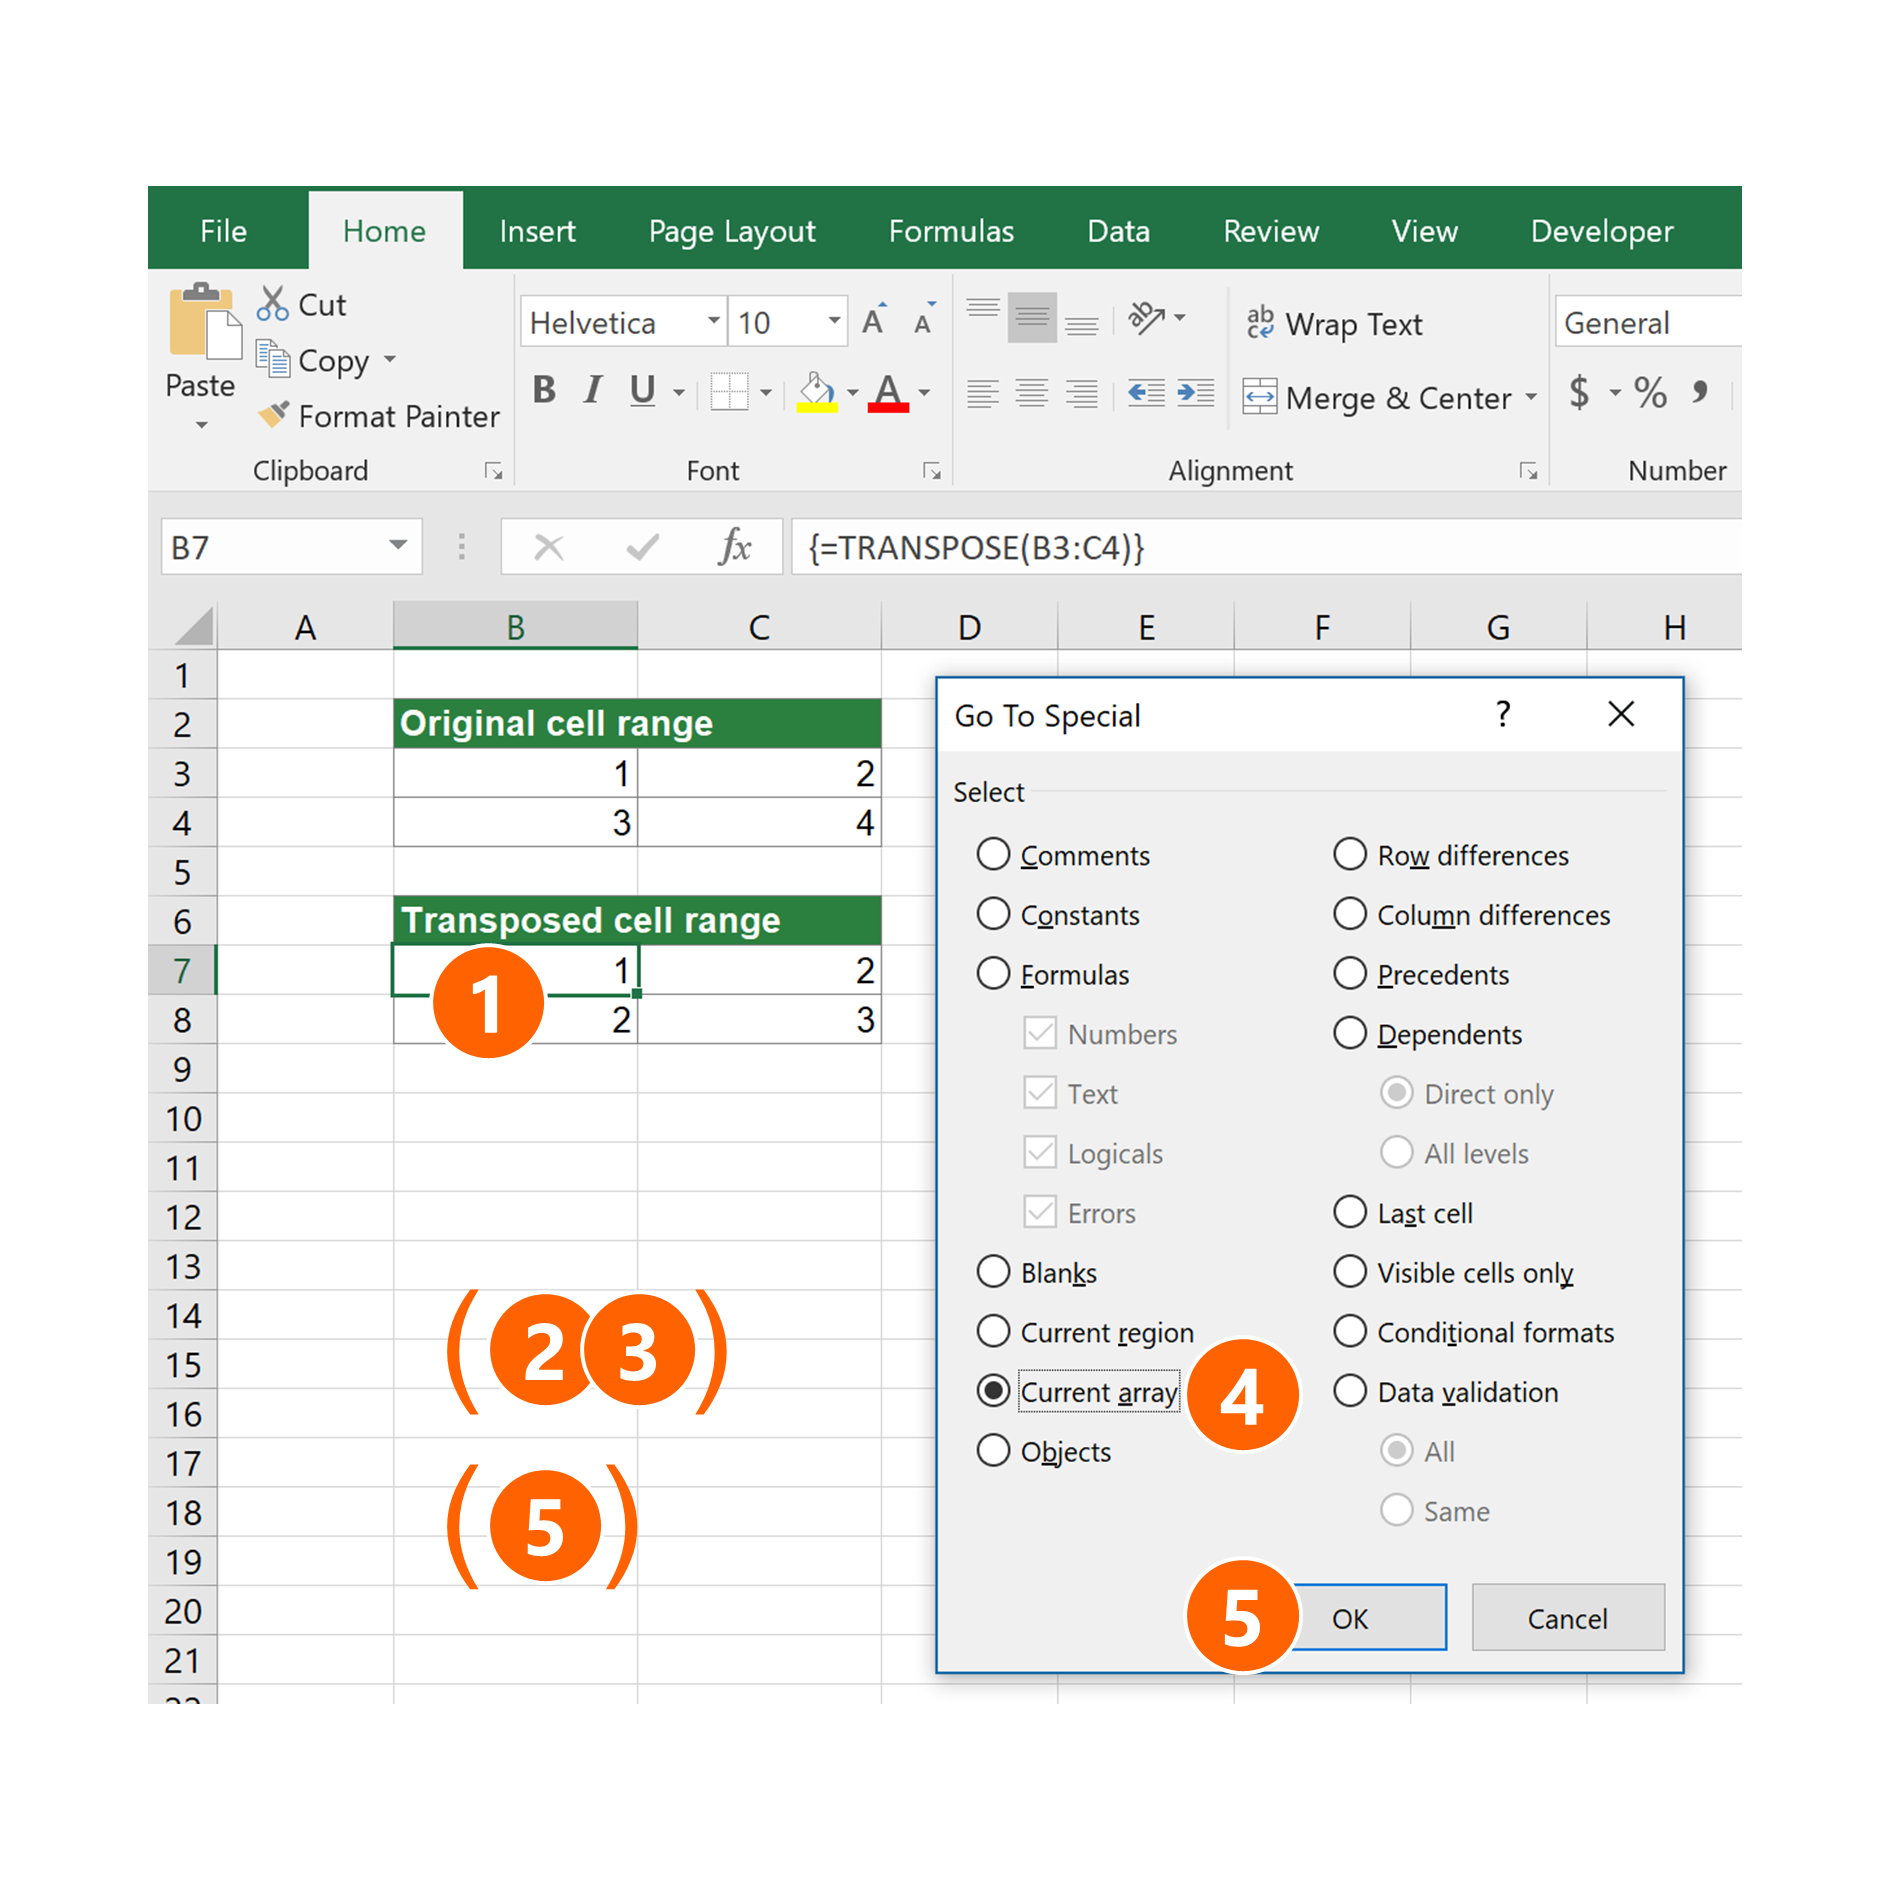
7. Advanced Functions
- Array Formulas : Learn about single and multi-cell array formulas.
- Dynamic Arrays : Functions like =UNIQUE(), =SORT(), =FILTER(), =SEQUENCE().
- Power Query: Importing, cleaning, and transforming data from various sources.
- Power Pivot : Creating complex data models and working with large datasets.
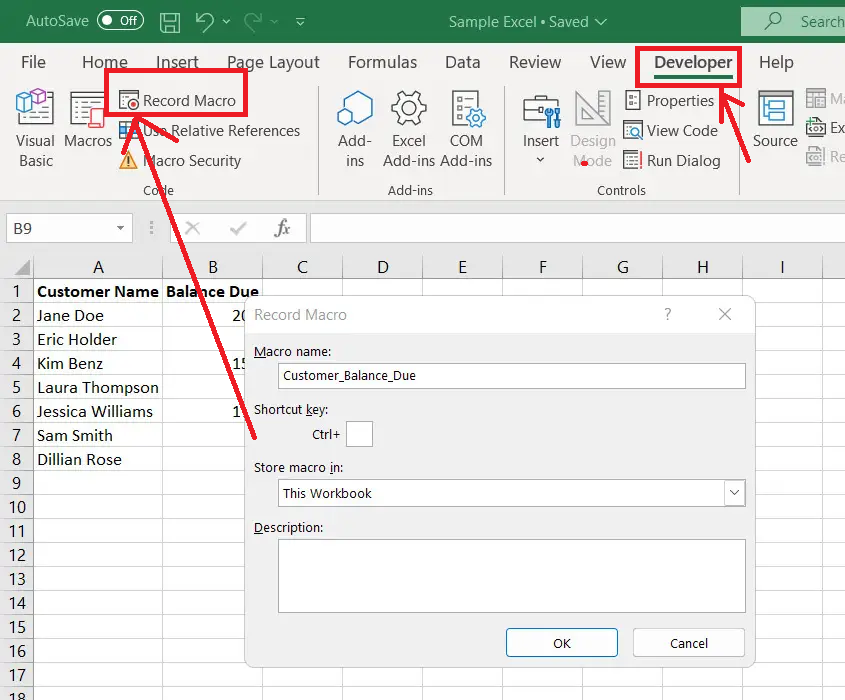
8. Macros and VBA
- Recording Macros : Automate repetitive tasks using the macro recorder.
- Introduction to VBA (Visual Basic for Applications) : Learn basic VBA programming for automating tasks.
- Creating Custom Functions : Write your own functions using VBA.
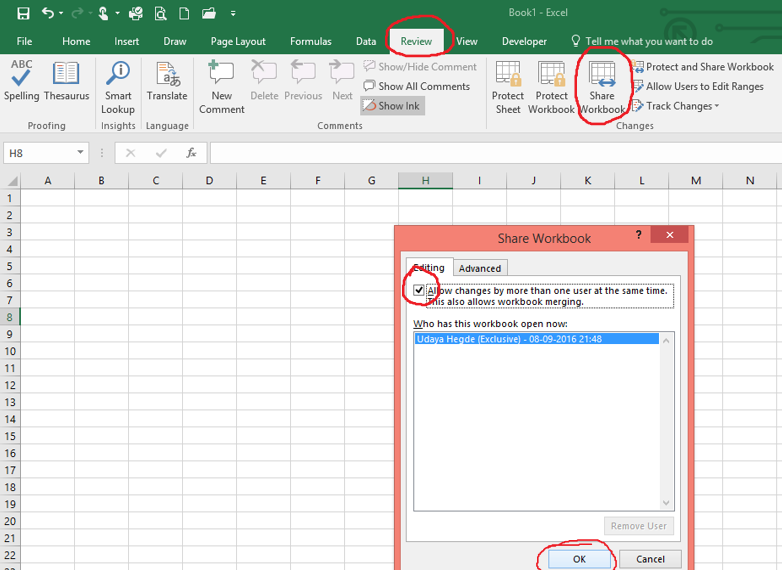
9. Collaboration and Sharing
- Sharing Workbooks : Collaborating on the same workbook with others.
- Track Changes : Tracking changes made by others in a shared workbook.
- Protecting Worksheets/Workbooks : Applying protection to prevent editing of certain sections.
- Comments and Notes : Adding comments to collaborate and provide feedback.
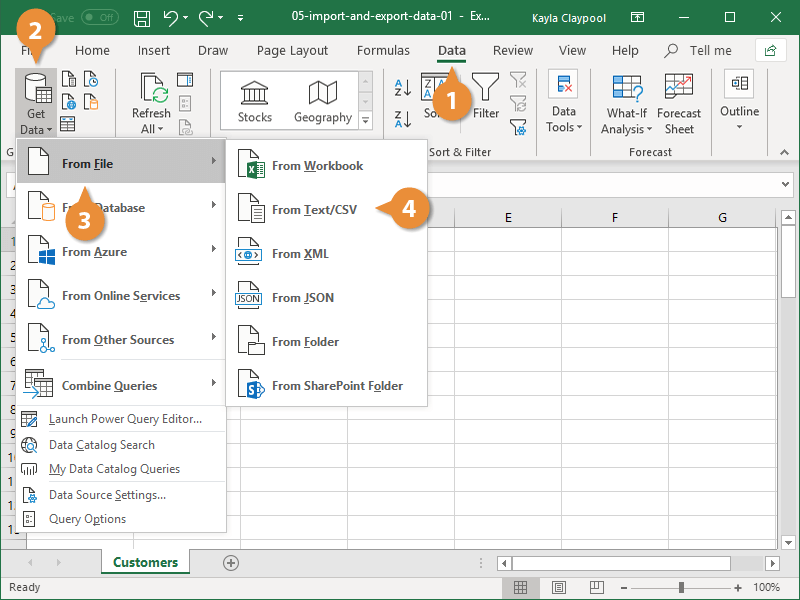
10. Data Import and Export
- Importing Data : Import data from external sources like text files, CSV, databases, etc.
- Exporting Data : Save data in different formats like CSV, PDF, etc.
- Connecting to External Data Sources : Use Power Query or external connections to databases.
10. References
https://www.guru99.com/excel-tutorials.html
https://trumpexcel.com/learn-excel/