
Team Dashboard Screen
 |
 |
 |
 |
 |
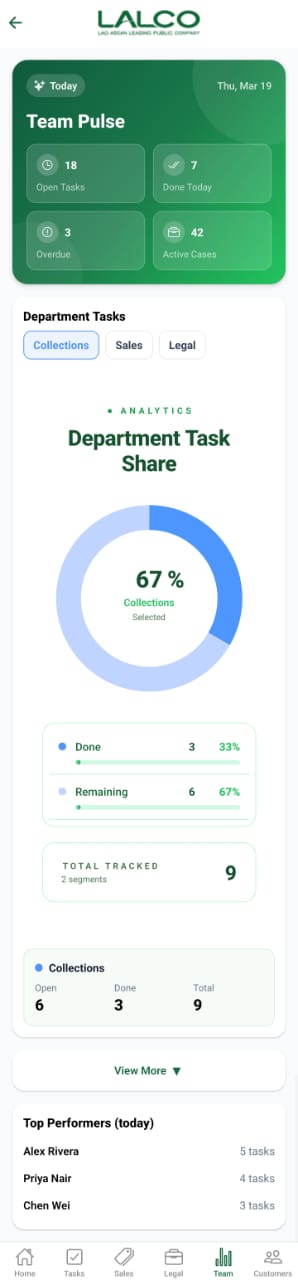
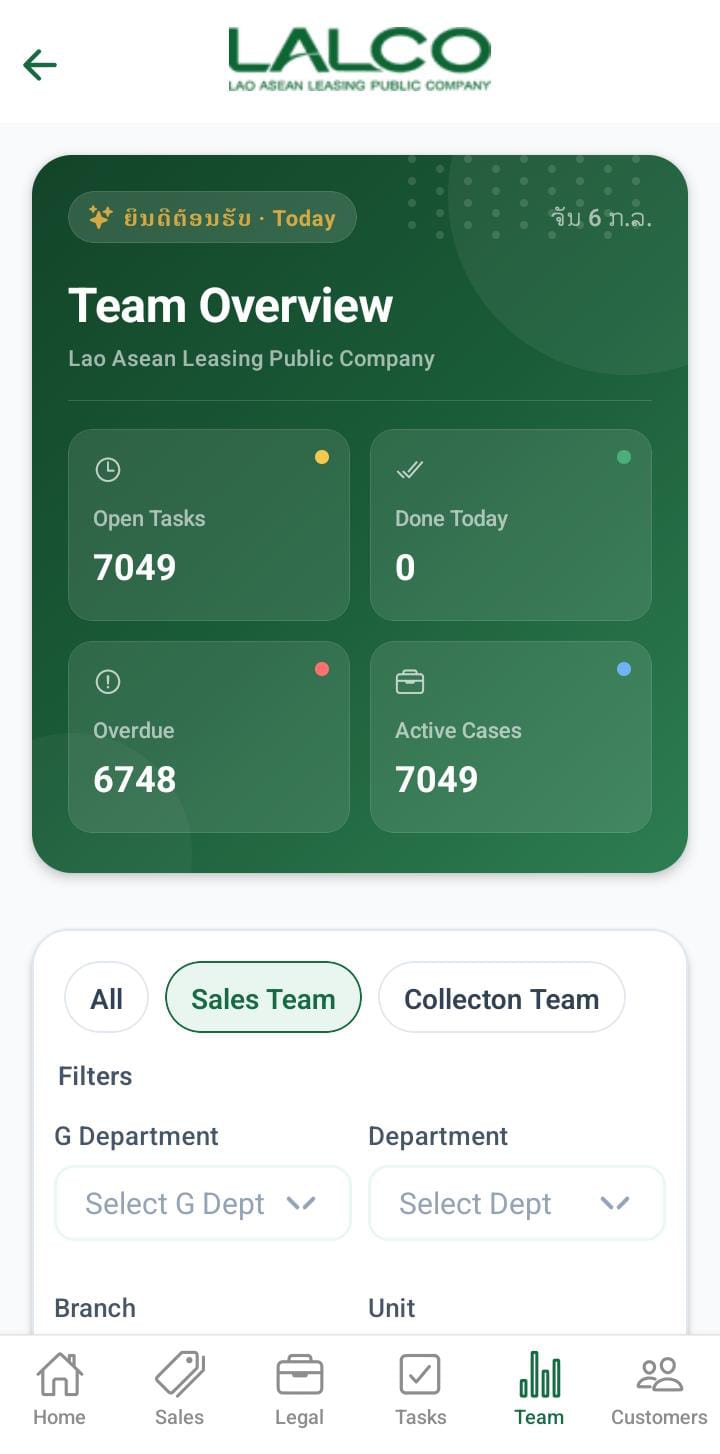
The Team Dashboard Screen provides a quick overview of team performance, task distribution, and case analytics. It helps staff monitor dailymonthly progress,cases.GPS trackoffline workloads, and identify top performers.count.
Header Section
Date Indicator
Displays the current working day.
Example:
Page Title
Team Pulse
Shows that this section focuses on team activity and performance.
Team Summary Cards
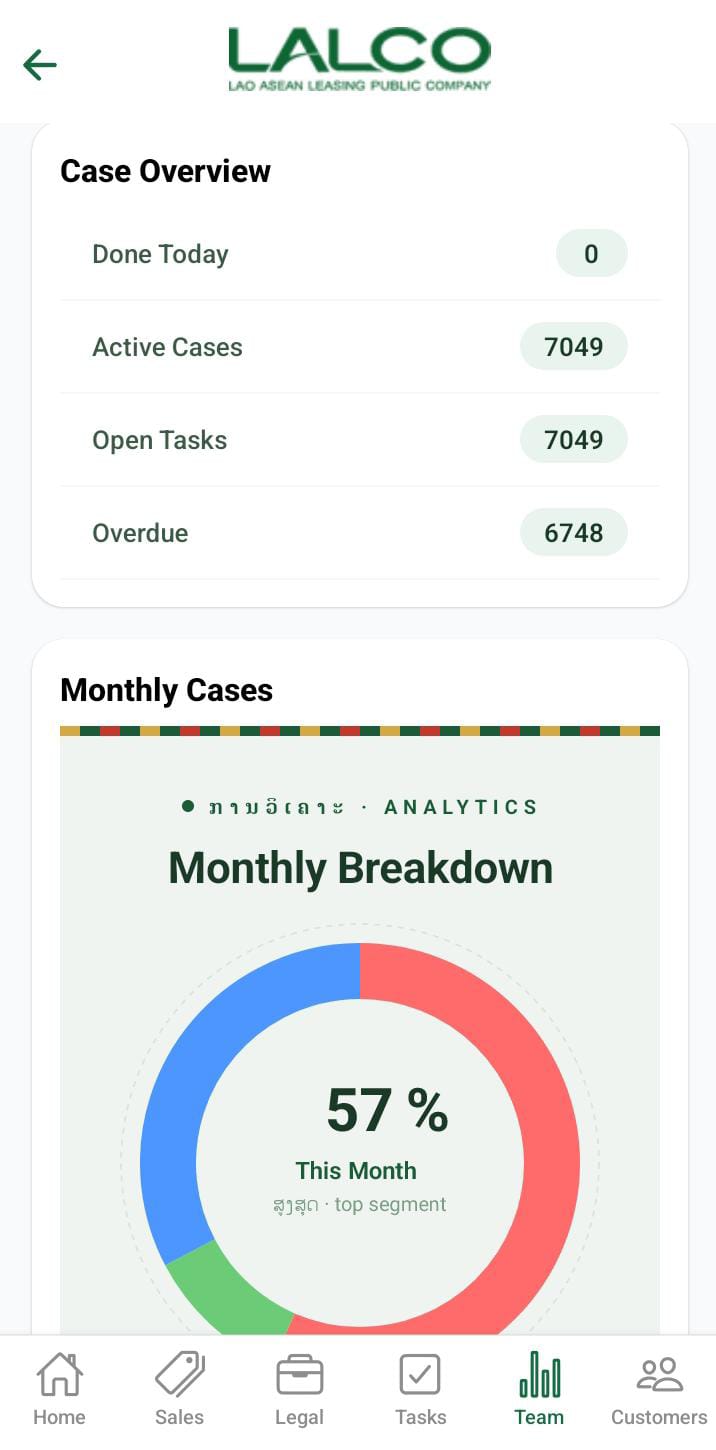
This section provides a quick snapshot of team activity:
-
Open Tasks → Total number of tasks
not yet completed -
Done Today → Tasks completed
onuntil the current day -
Overdue →
TasksOverduethatcontracthavecountpassed their deadline -
Active Cases → Total ongoing
casescontract count handled by the team
Department Tasks
Tabs
Users can switch between departments:
-
Collections team
-
Sales
Legalteam
This allows viewing performance data for each department separately.
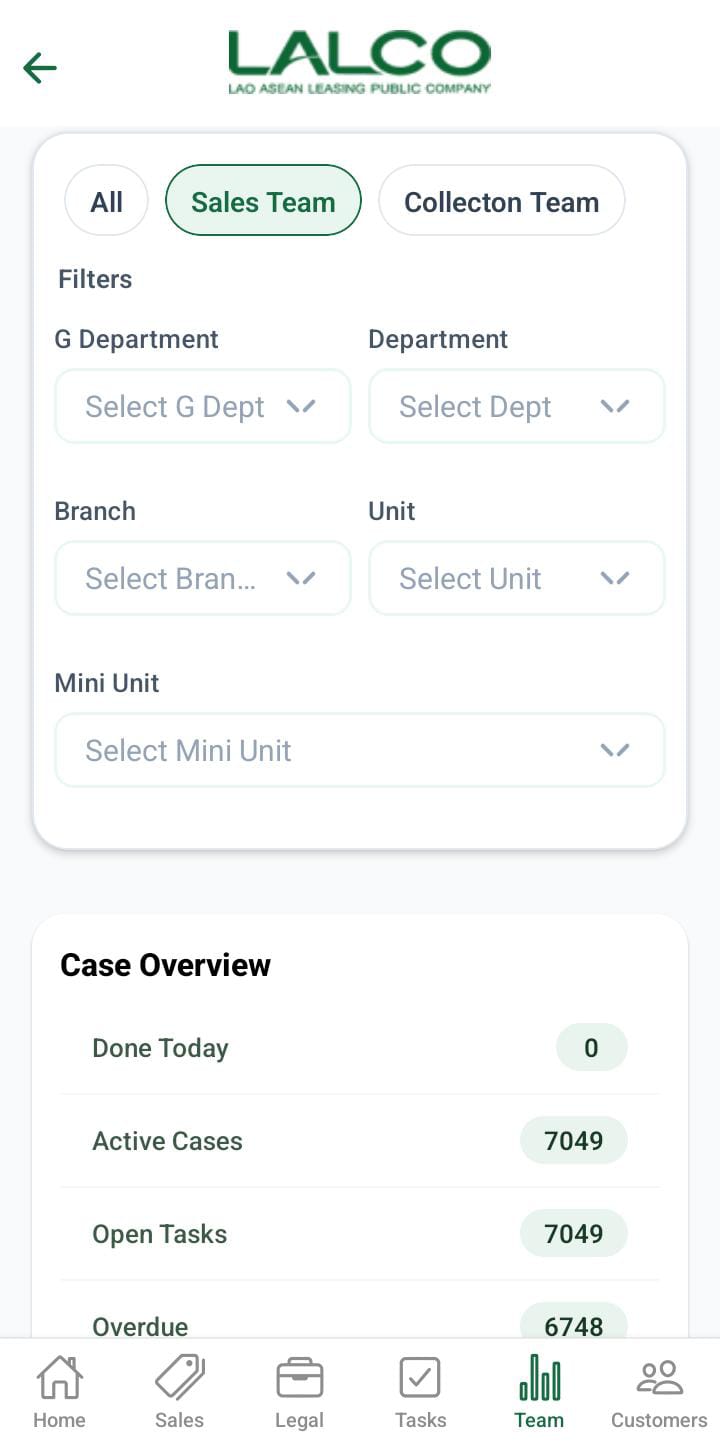
User can apply the gdept, dept, sec_branch, unit,munit filter for the sales team.
User can apply the gdept, dept, collection unit, collection tl and collection filter for the collection team.
Analytics Section
DepartmentCase Task Share
Displays a visual chart showing task distribution.
Example:
Task Breakdown
overview
 Done
Done
payment collection contract countDoneToday→-CompletedTodaytasks- Active
activeRemainingcases→-PendingTotaltasks
Each includes:
Taskcontract count- Open
- Total task countPercentageTaskprogress - Overdue - Total overdue contract count
TotalMonthly Tracked
break Shows the total number of tasks being monitored.
Example:
Department Summary
Displays task details for the selected department.
Example (Collections):
Open→ 6Done→ 3Total→ 9
View More Option
View More Buttondown
Expands the dashboard to show additional analytics and detailed data.
Top Performers Section
Top Performers (Today)
Displays staff members with the highest task completion.
Example:
Alex Rivera → 5 tasksPriya Nair → 4 tasksChen Wei → 3 tasks
Additional Analytics (Expanded View)
When expanded, the dashboard shows deeper insights:
Case Statistics
Total Cases→ Overall number of casesPaid→ Successfully completed/paid casesNot Paid→ Pending or unpaid cases
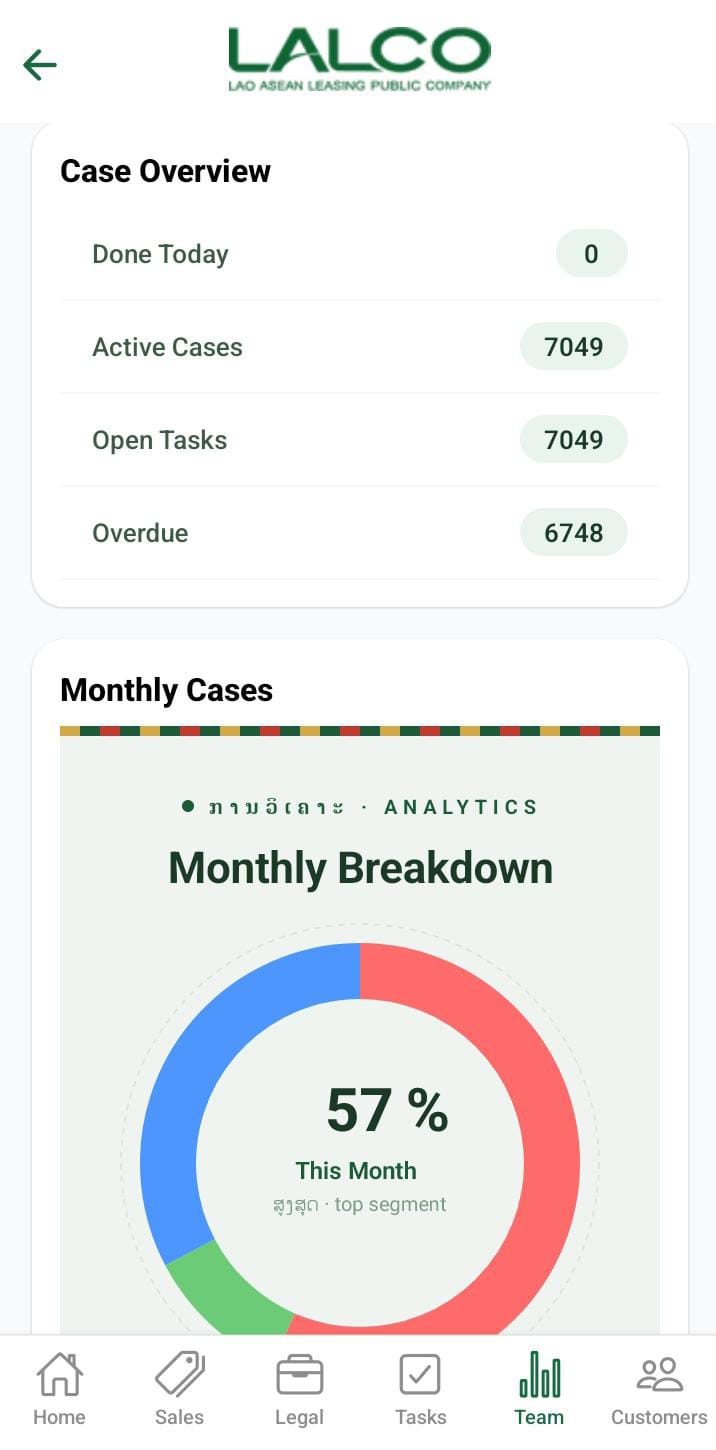
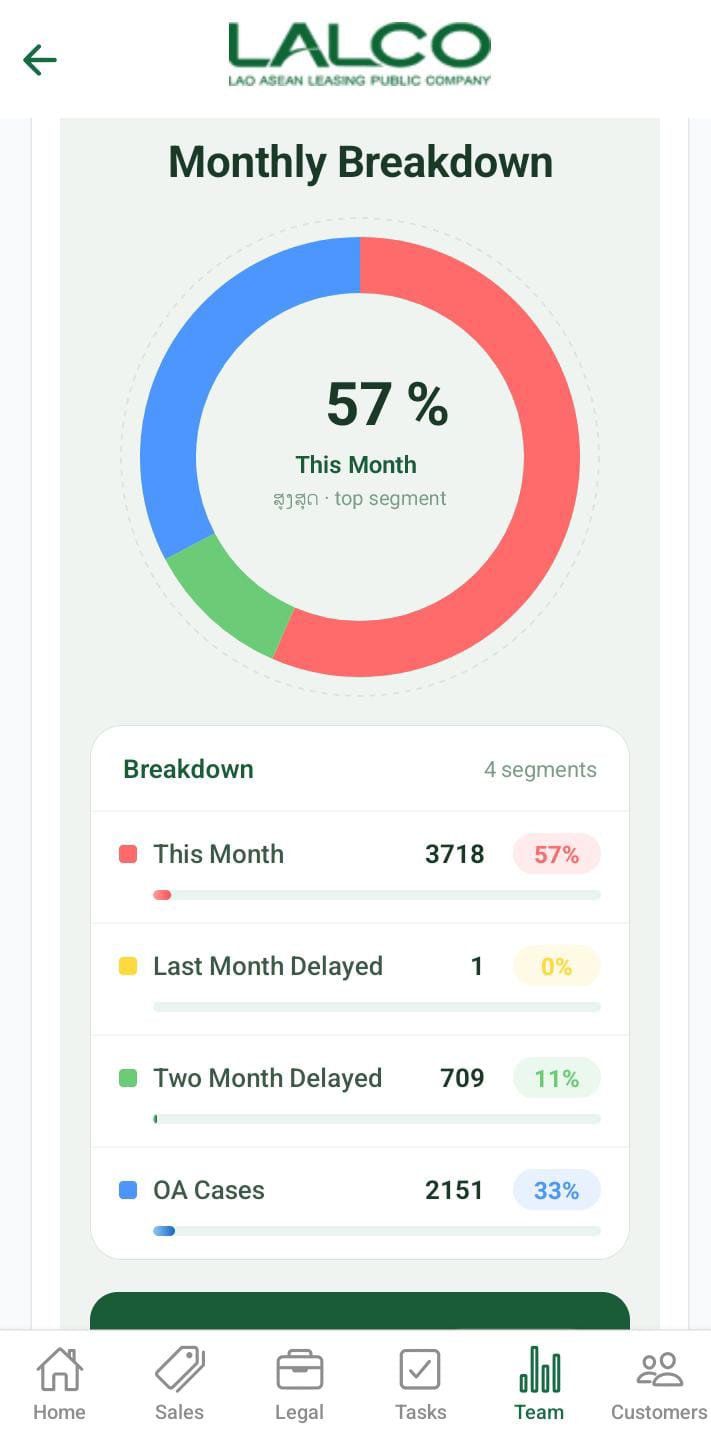
Monthly Cases
Displays a visual breakdown of case categories. These amounts will display according to the applied payments.
Includes:
-
This Month
-
Last Month
-
2
MonthMonths Delayed -
OA Cases
Each SOA Casesshows:
Each shows:
-
Number of cases
-
Percentage contribution
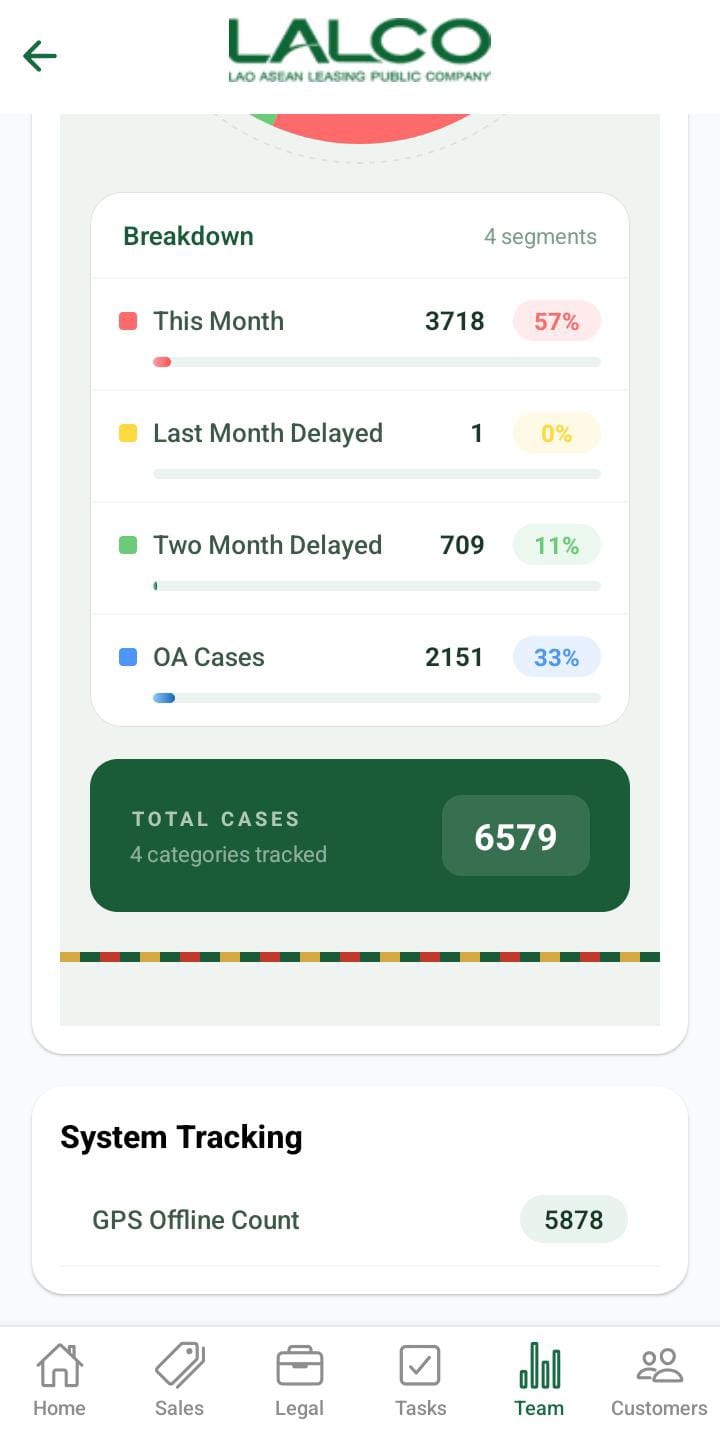
Total Tracked (Analytics)
Shows total number of tracked segments.
Example:
Case Types & Tracking
Displays system-related tracking information.
Example:
GPS Offline→ Indicates location tracking issues
How to Use
View Team Performance
-
Open the Team tab
Review summary cardsAnalyze department performance
Switch Department
-
Tap Collections / Sales
/ Legal -
View updated analytics
Expand Analytics
TapView MoreReview detailed reports
💡 Tip:Use this screen daily to monitor team productivity, overdue tasks, and performance trends.